From The Top
The Dashboard homepage is a long, scrolling, continuous page with all the key information a Partner needs.
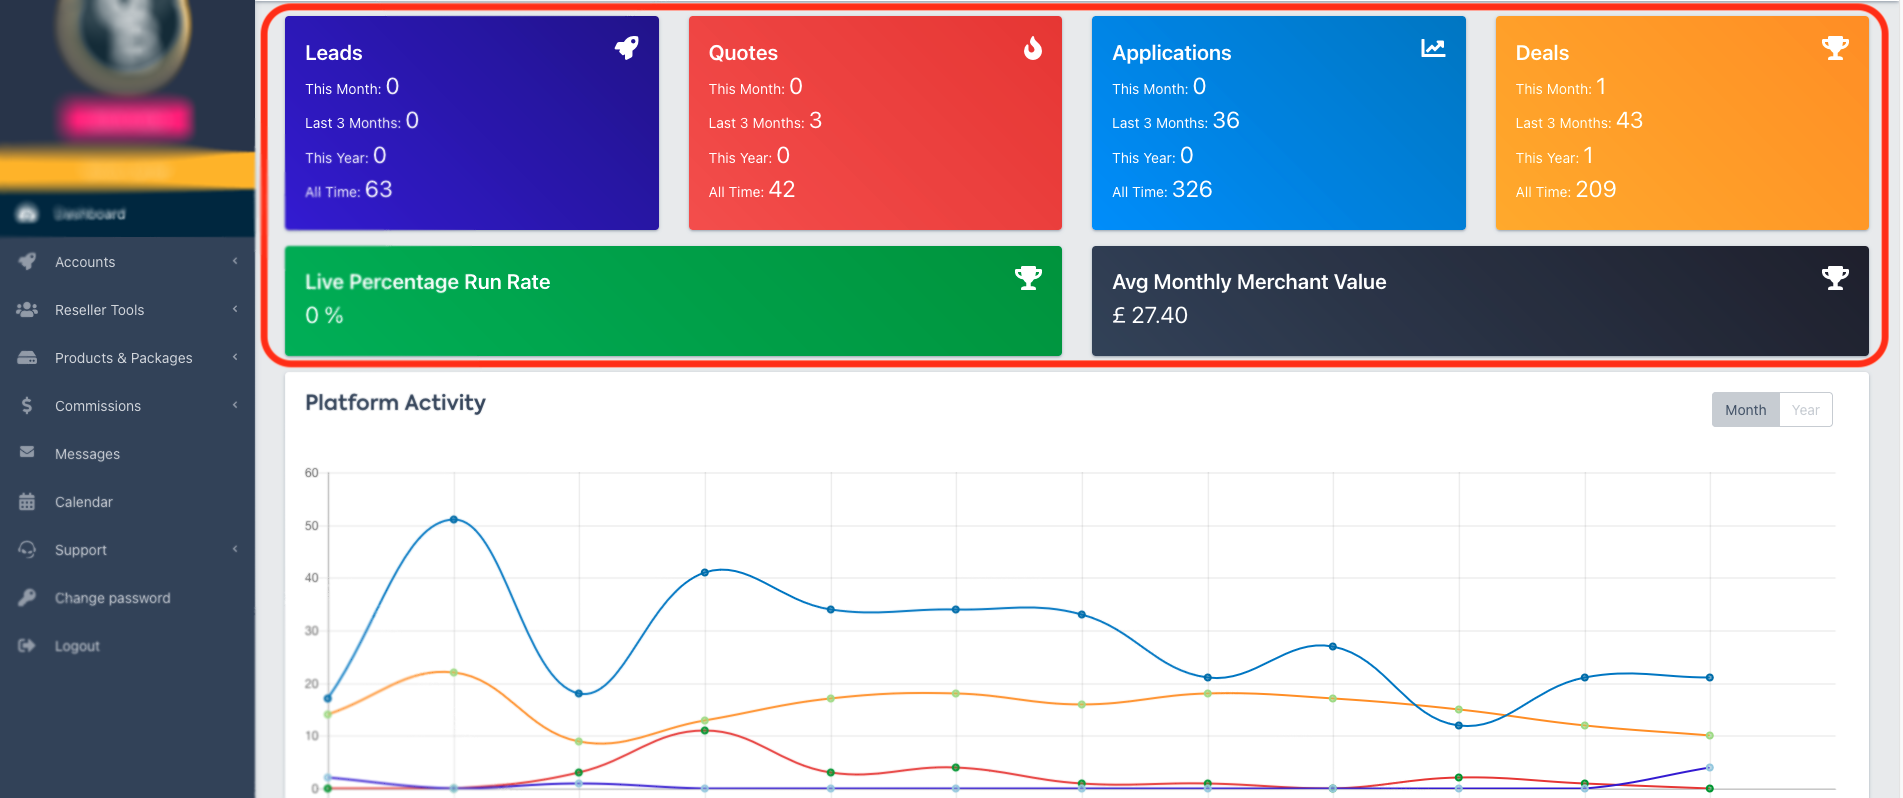
The first four cards on the Dashboard Interface show your monthly, quarterly, yearly and all-time figures, grouped by stages of the Merchant’s journey with you.
Below that, you’ll see your Live Percentage Run Rate, and your Average Monthly Merchant Value, and a graph with all the activity you've added to the platform.
Platform Activity
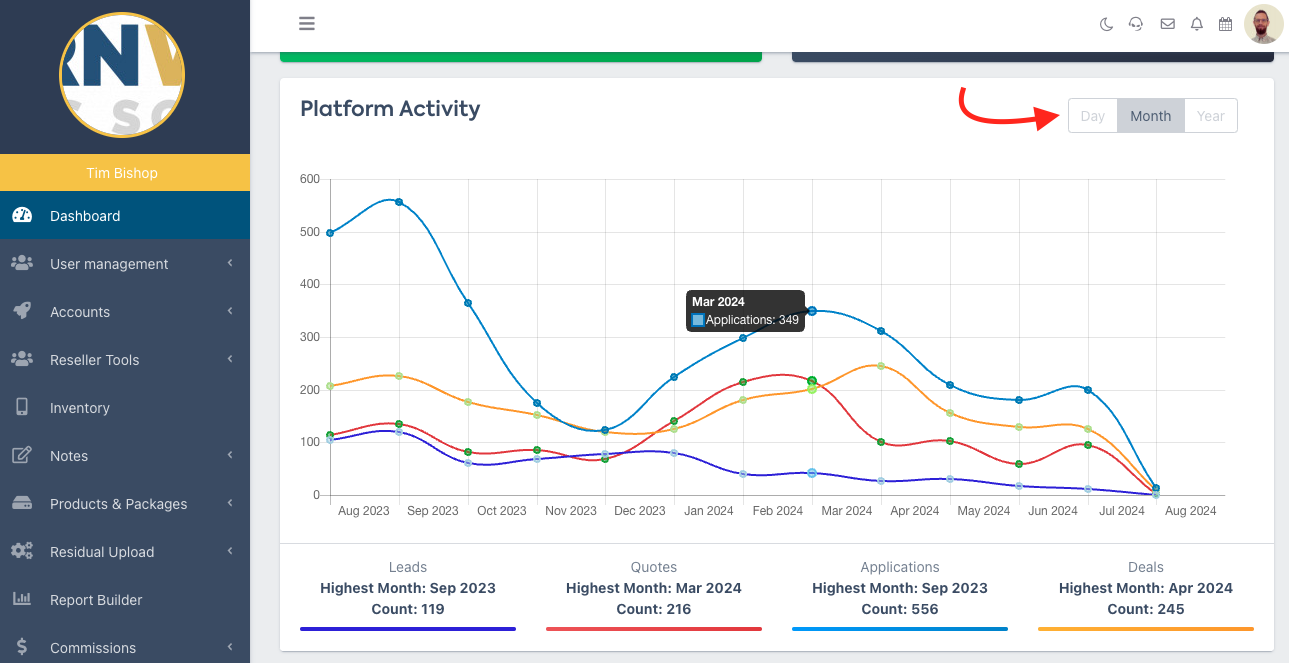
Next, the Platform Activity section shows a graph of your Leads, Quotes, Applications and Deals by month, or year.
💡 Use the toggle on the top right to switch between Day, Month and Year views
Hover over a ‘point’ on the line graph to see the exact figure
Platform Activity is also shown in pie chart form below the graph, with a more detailed breakdown by status.
💡Hover over a pie chart segment to see the corresponding status.