Estate
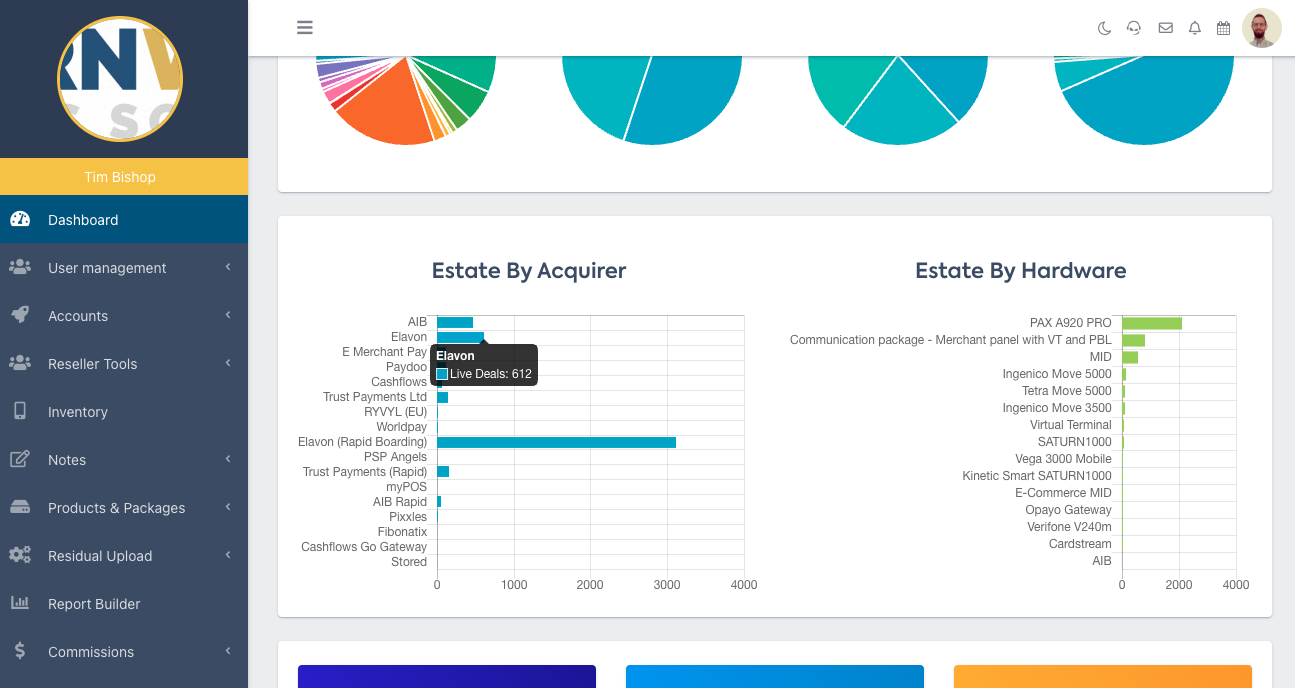
The graphs display your Estate by Acquirer, and by Hardware.
Underneath these graphs the top three cards show your average Rental Term, Hardware Rental and Authorisation Fee. The bottom three show your Live Deals, Cancelled Deals and Attrition Rate.
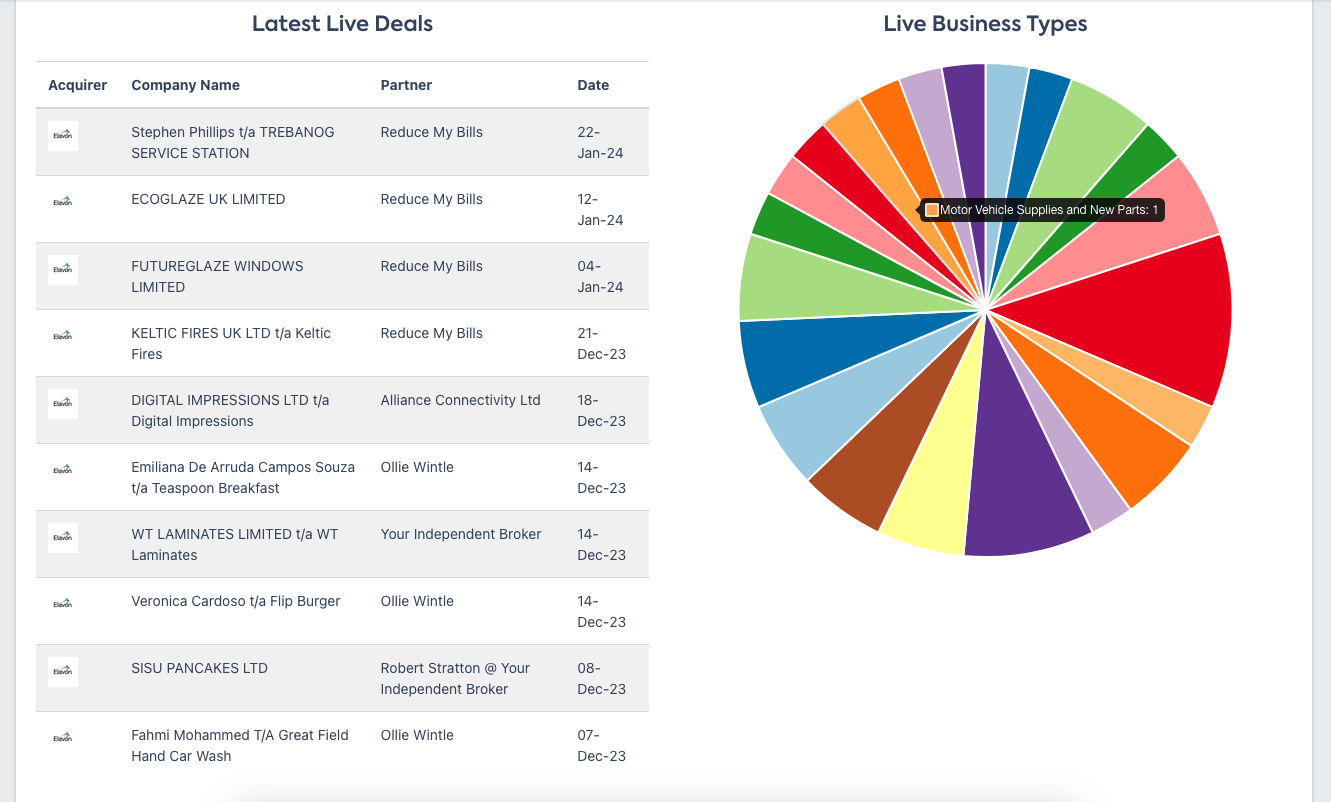
Alongside the list of your Latest Live Deals, you’ll see a pie chart which breaks down your merchants by industry.
TIP: Hover over a segment of the pie chart to see the corresponding industry.
You can do the same for the two following pie charts:
- Live Merchant Type
- Merchant Account Type.
Estate Turnover
In Estate turnover, you’ll see a graph tracking your estate's monthly performance and Total Estate Turnover Year to Date.
TIP: Hover over a ‘point’ on the graph to see the exact figure.
Hovering over the next two graphs (Residual and Ancillary Earnings) will also display the exact figures.
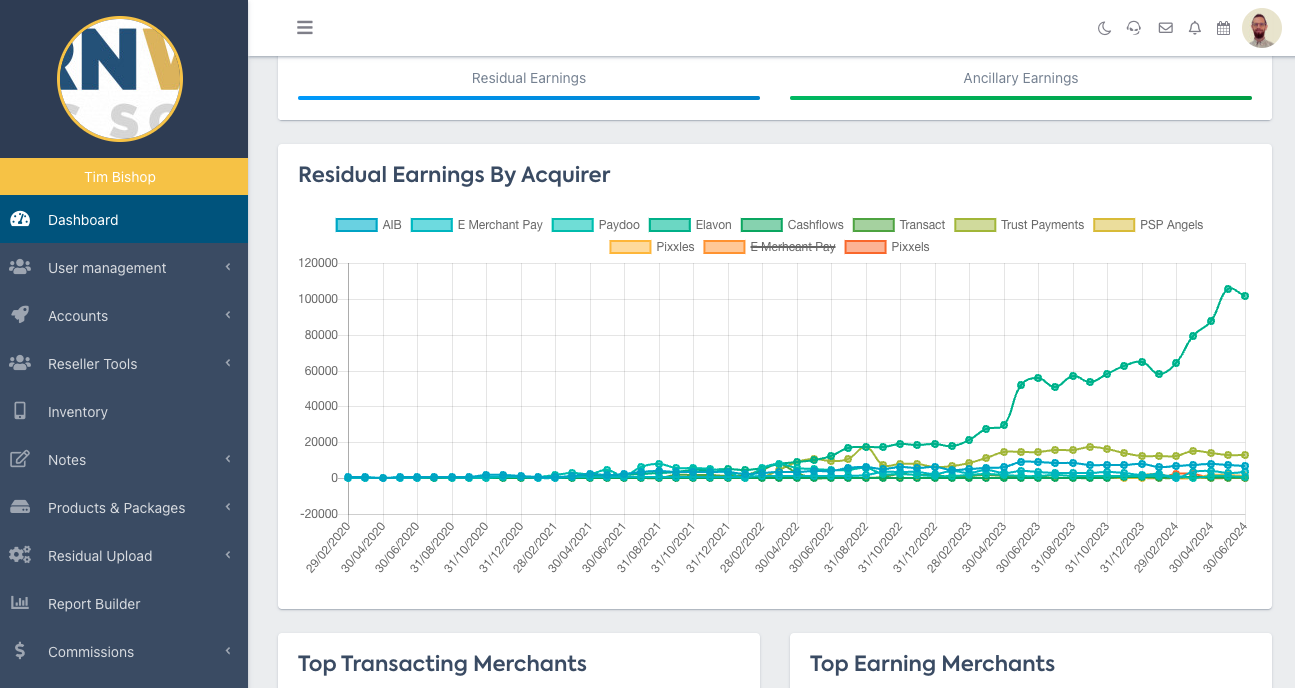
Residual Earnings by Acquirer
The Residual Earnings by Acquirer graph is interactive, allowing you to filter by one, some or all of the Acquiring Banks on our Partner Portal.
You can exclude an Acquirer, by clicking on their name above the graph.
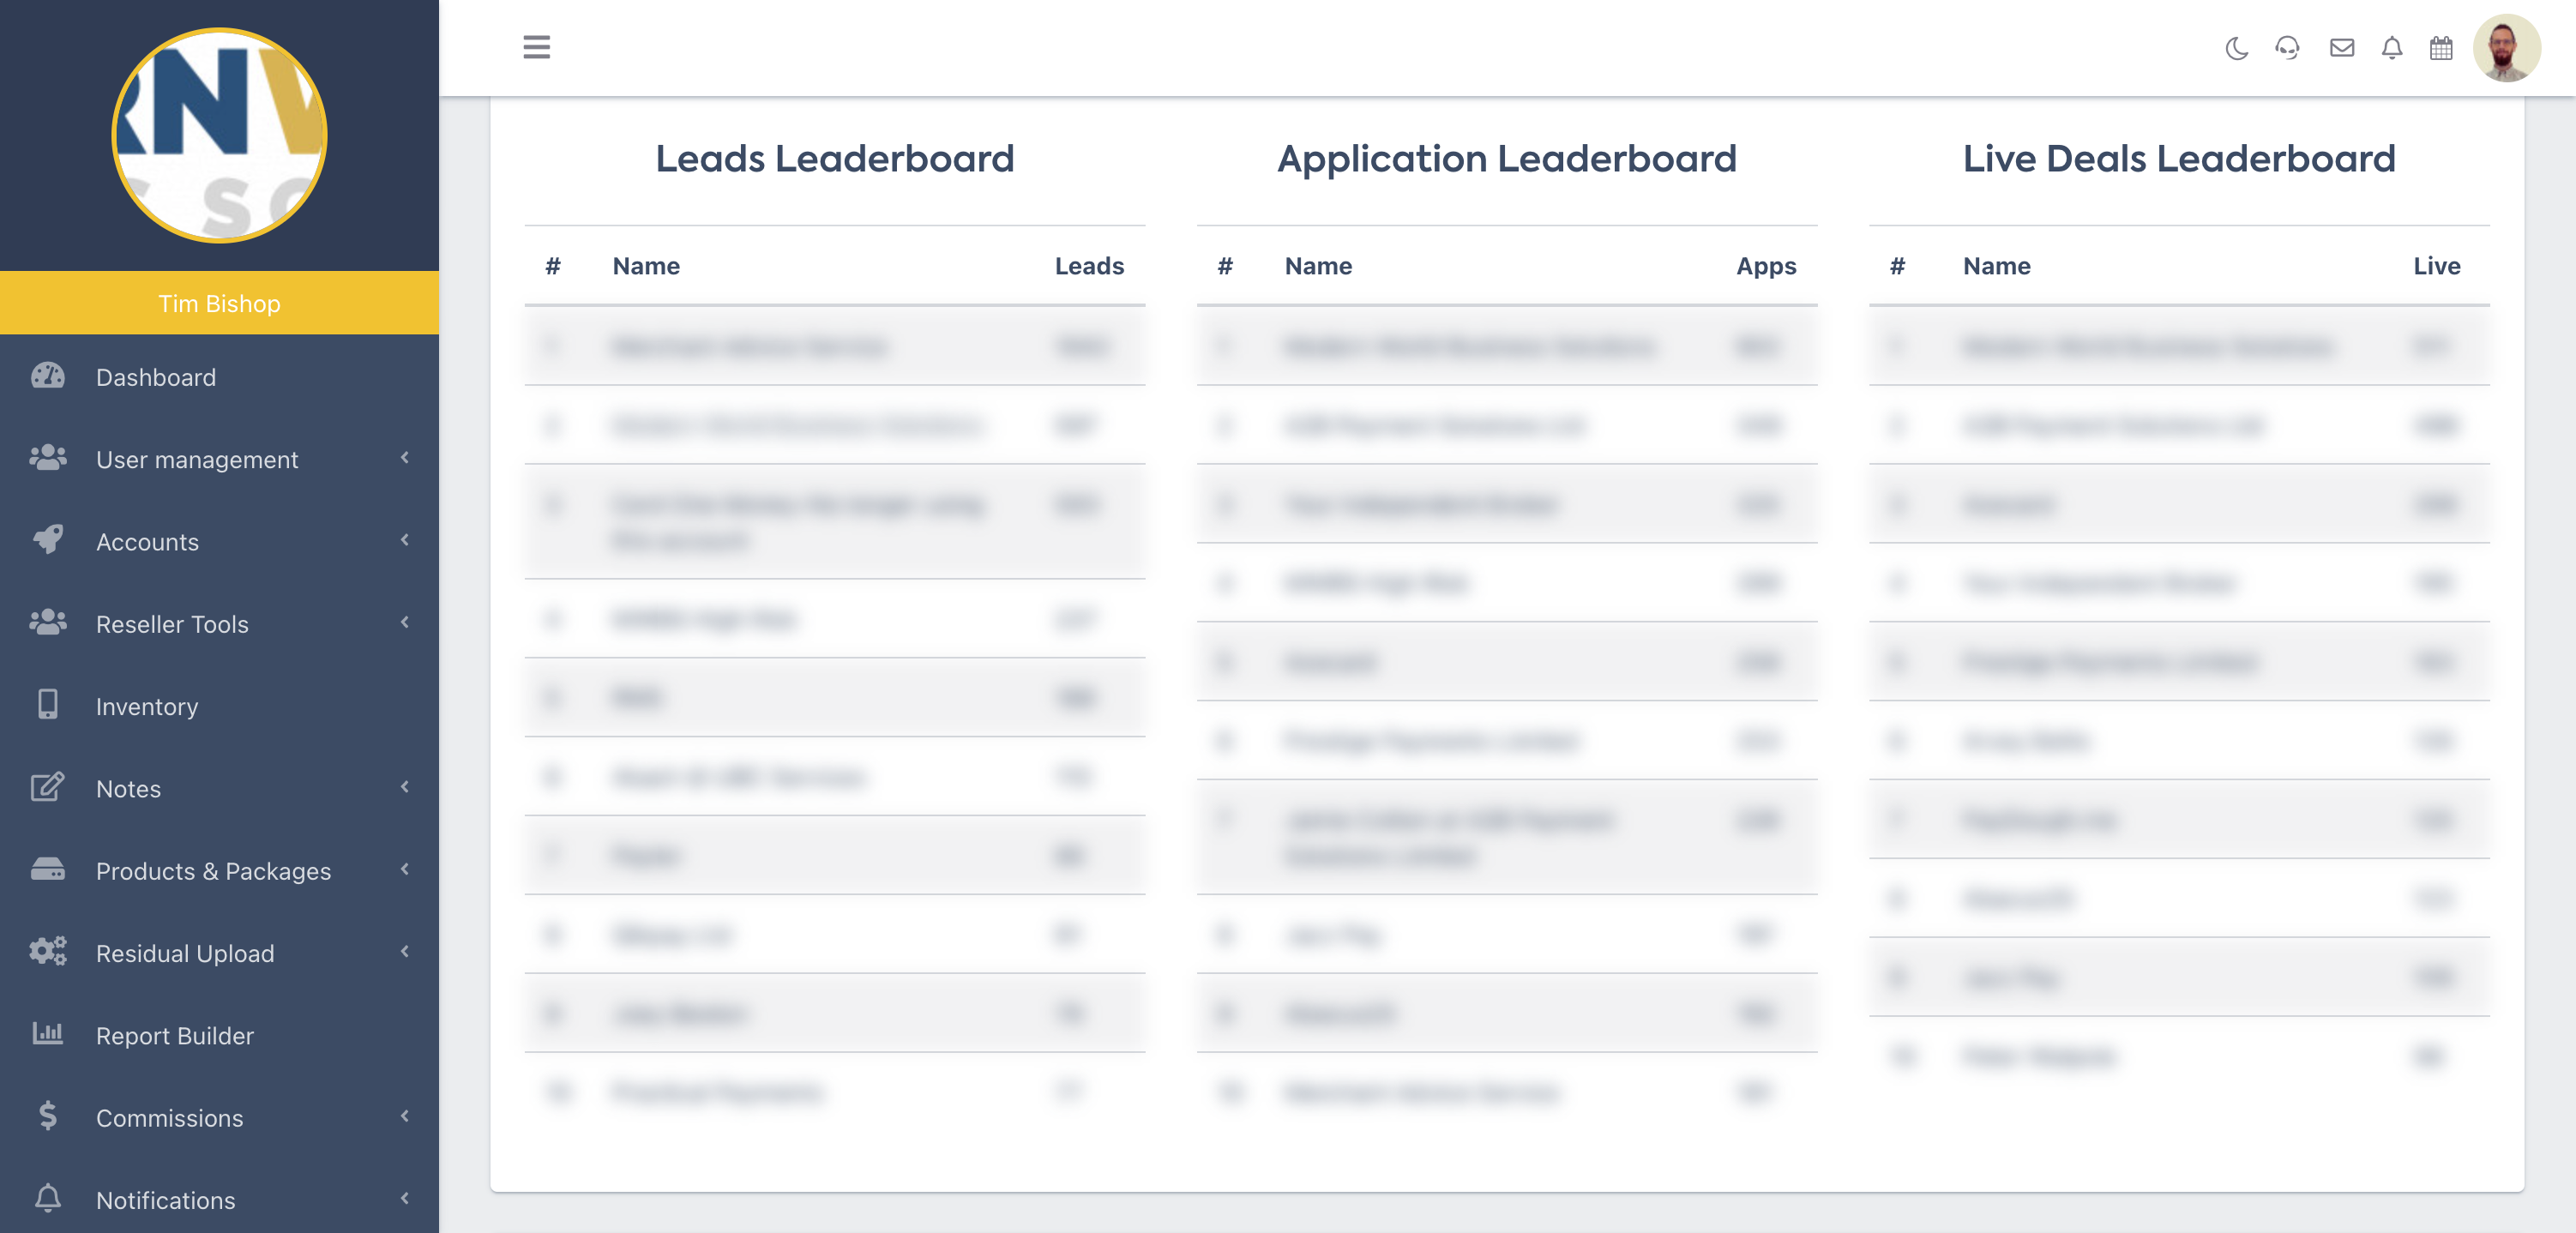
Estate Leaders
Finally, at the bottom of the Dashboard are your Top 10 performers by:
- Transacting Merchants
- Earning Merchants
- Ancillary Earning Merchants